
Once You Use This Debugger, You’ll Never Go Back
No matter how skilled we are, bugs find a way to sneak into our code.
But,
What if I told you that debugging could be faster, smarter, and more efficient?

💼 Want to Work at Google, Meta, Amazon, or Other Top Tech Companies? Here’s How!
CodeToDeploy has partnered with Careerist to bring you a proven path to land roles at Google, Meta, Intel, and more. Imagine earning a high salary, building world-class projects, and learning directly from top 1% industry mentors.
🚀 Here’s what the program offers:
- ✅ 1:1 mentorship from top tech experts
- ✅ Hands-on projects that impress recruiters
- ✅ Job-ready skills tailored for big tech success
- ✅ Money-back guarantee if you don’t land a top role
💡 The best time to invest in yourself is now.
👉 Start Your Journey Today
With the right tools — especially AI-powered ones — you can save time and focus more on building great applications.
Here’s a list of 10 powerful debugging tools that every developer should know, along with how they work and why they’re helpful.
Let’s dive in!
Here’s a list of 10 powerful debugging tools that every developer should know, along with how they work and why they’re helpful. Let’s dive in!
1. Chrome DevTools
Link: Chrome DevTools
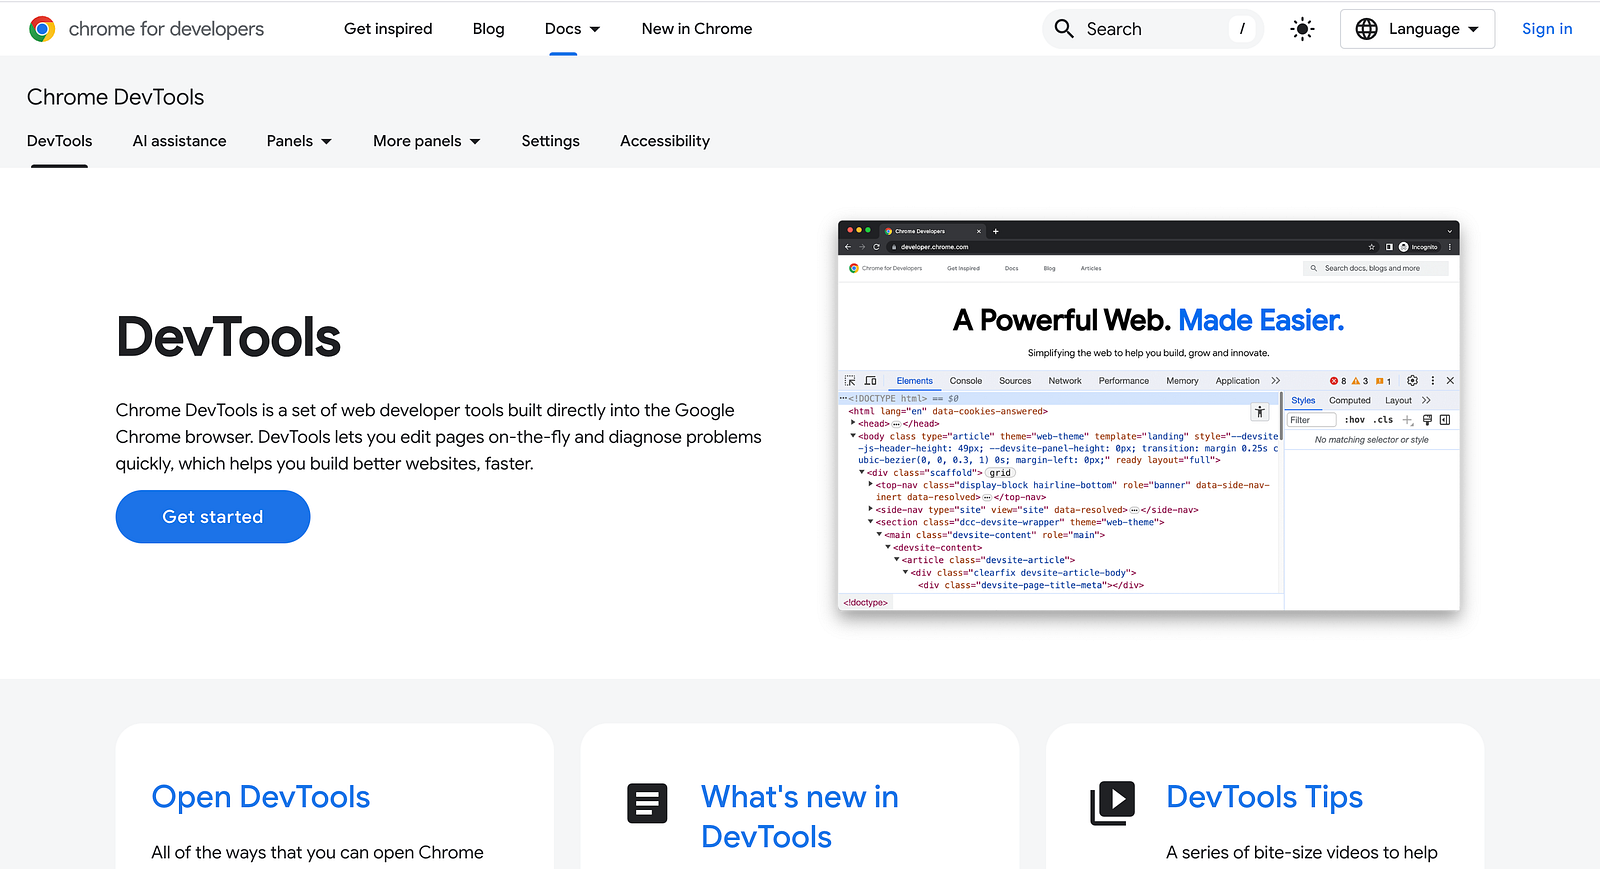
This built-in browser tool allows developers to inspect and debug JavaScript, analyze network requests, and fine-tune performance.
Why It’s Helpful:
Essential for front-end developers, it helps identify rendering issues, optimize load times, and inspect CSS changes in real time.
2. Visual Studio Code Debugger
Link: VS Code Debugging

The integrated debugger in VS Code lets you set breakpoints, step through code, and inspect variables without leaving your editor.
Why It’s Helpful:
It streamlines debugging within the development environment, making it faster and more intuitive.
3. Postman
Link: Postman

Postman is a powerful API testing tool that allows developers to send requests, inspect responses, and automate tests.
Why It’s Helpful:
Helps developers debug API issues, analyze request/response data, and automate test cases for smooth backend integration.
4. Sentry
Link: Sentry

Sentry provides real-time error tracking across multiple languages and frameworks, helping developers pinpoint issues quickly.
Why It’s Helpful:
It captures stack traces, logs errors in production, and even offers AI-driven insights to suggest fixes.
5. Redux DevTools
Link: Redux DevTools
This tool allows developers to track and debug state changes in Redux applications, with time-travel debugging.
Why It’s Helpful:
Ideal for React developers working with Redux, as it makes managing application state and debugging complex data flows much easier.
6. Xcode Debugger
Link: Xcode
Apple’s built-in debugging tool for iOS/macOS development, allows step-by-step execution and performance analysis.
Why It’s Helpful:
Essential for iOS developers to test, debug, and optimize their apps before deployment.
7. PyCharm Debugger
Link: PyCharm

A powerful Python IDE with an integrated debugger for stepping through code, analyzing variable states, and catching exceptions.
Why It’s Helpful:
Best for Python developers who need deep debugging insights without leaving their development environment.
8. LogRocket
Link: LogRocket

How It Works: LogRocket records user sessions, allowing developers to see exactly what happened before a bug occurred.
Why It’s Helpful: Helps diagnose UI issues, improve user experience, and debug JavaScript errors efficiently.
9. Lightrun
Link: Lightrun

How It Works: A real-time debugging tool that lets developers add logs, metrics, and snapshots to running applications.
Why It’s Helpful: Reduces the need for redeployments and makes debugging live applications much easier.
10. AI Debugging with Copilot/X
Link: GitHub Copilot
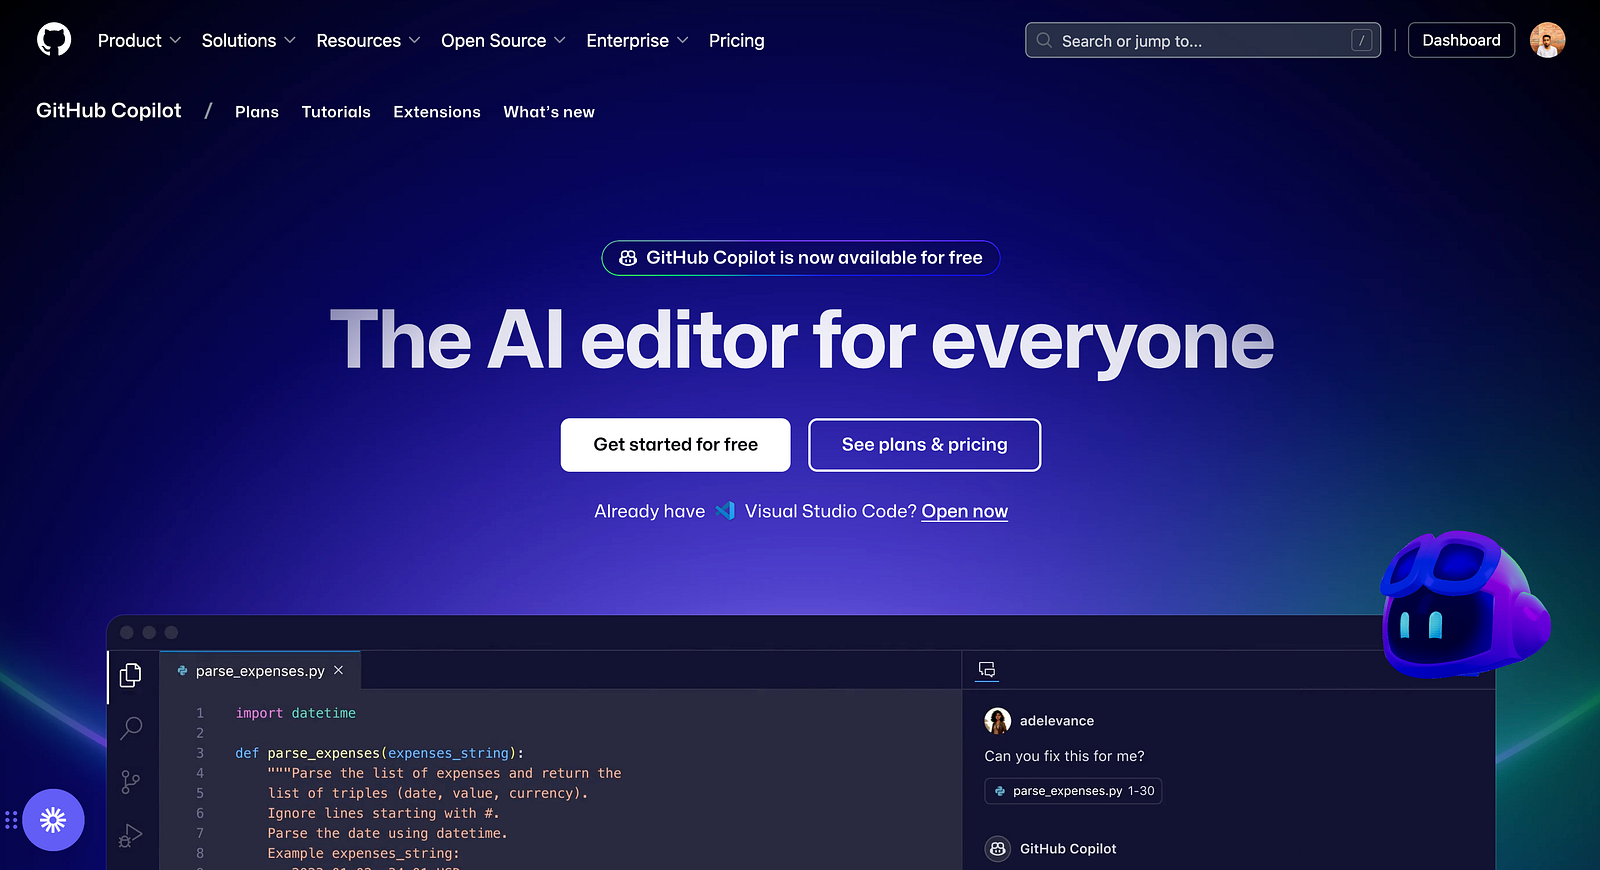
AI-powered tools like GitHub Copilot suggest fixes, generate code, and even debug issues by analyzing patterns.
Why It’s Helpful:
AI assisted debugging speeds up development and helps identify patterns that may not be obvious manually.
Debugging doesn’t have to be a frustrating experience.
With the right tools, you can catch and fix issues quickly, improve code quality, and save valuable development time. Whether you’re working on a web app, mobile application, or backend service, these debugging tools will make your Developer life easier.
Writer : Bhuwan Chettri